While the coronavirus doesn’t discriminate, we’ve definitely seen some categories do better than others based on shifting consumer behaviors in a shelter-in-place environment. Our industry can better navigate this dynamic environment by understanding which categories are doing well and which categories are struggling. To help our community do just that, CommerceNext turned to Signifyd, who has been analyzing transactional and behavioral data across 10,000+ merchants in 100+ countries.
Below is a summary of their findings. All figures are normalized to the week of 2/25-3/2, as a representation of pre-pandemic “steady state” shopping volumes. We will be updating this data regularly and hope it is helpful as our industry navigates this dynamic environment.
Episode 1 – Sales continue to grow amid dramatic swings
Social media quickly turned the epochs “B.C.” and “A.C.” into “Before COVID-19” and “After COVID-19,” and this is especially true in consumer data. The week the World Health Organization declared a pandemic, online sales spiked—and the numbers tell the story of a collective consumer desire for security and protecting what is dear.
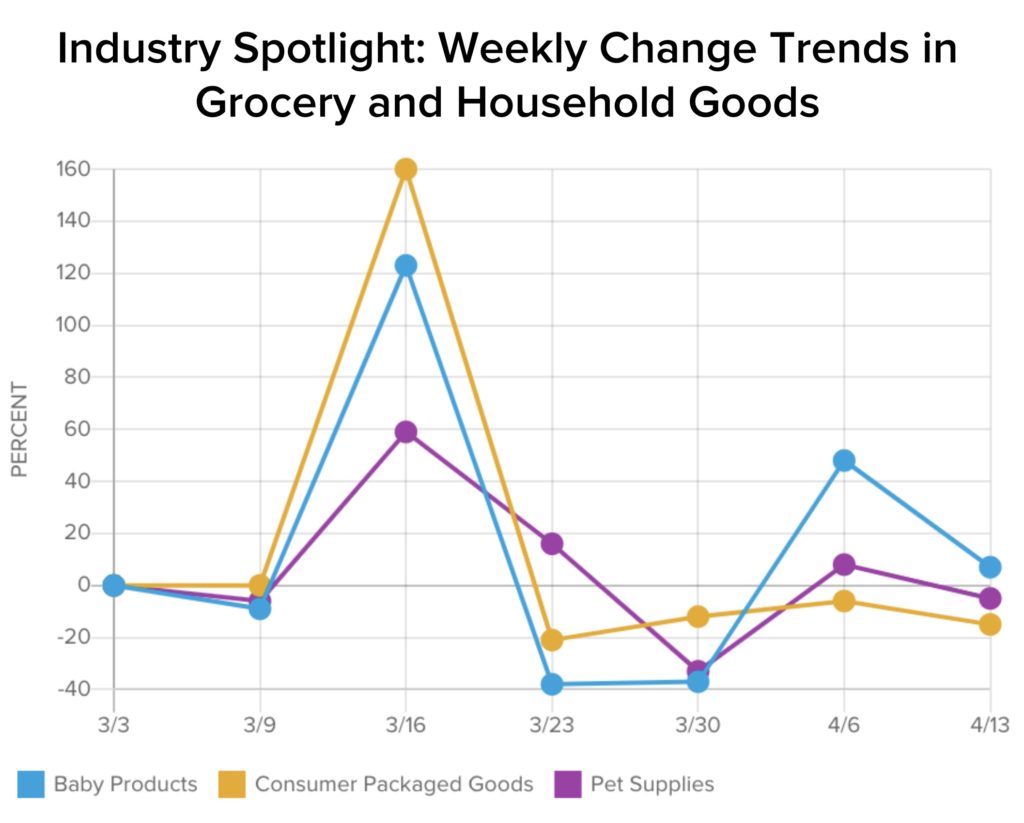
In the week of March 10th, grocery sales shot up 110% and the category that includes gold bars shot up 123%. The sale of baby products soared 123% as employers started sending workers home indefinitely and rumors of impending stay-at-home orders began circulating. Pet supplies sales went up 59%. And no, the difficulty in securing toilet paper was not just trending gallows humor—packaged goods were up 160%, undoubtedly driven by sales of toilet paper, cleaning products and paper towels.
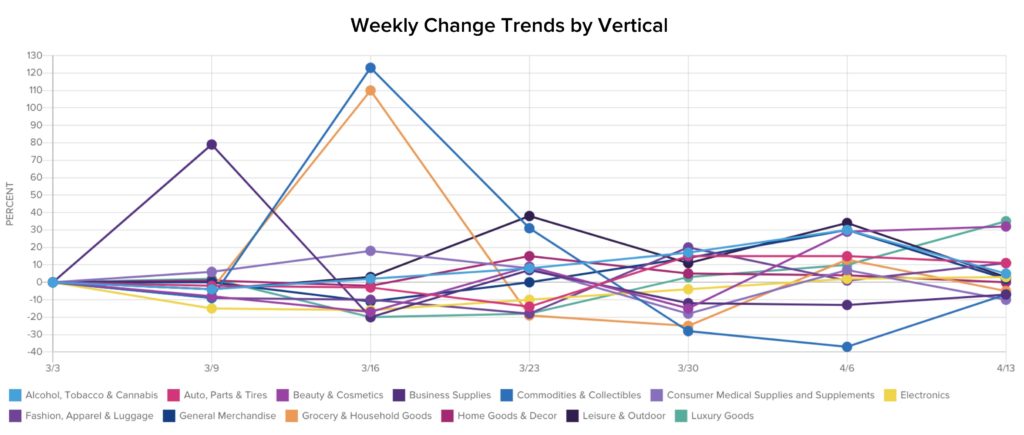
With the spread of coronavirus, shopping appetites changed rapidly. The sale of luxury goods dropped 20% with beauty and cosmetics down by nearly the same and electronics by 15%.
Unfortunately for consumers, with higher volumes of ecommerce purchasing comes higher risk of fraud. 43.1% of online shoppers currently report using four or fewer passwords across all their online accounts and 41.7% say they never change passwords on their retail accounts. This leaves an ecommerce landscape ripe for an aggressive fraud wave.
This now hyperactive ecommerce environment is likely to provide the kind of chaos that fraud thrives in for weeks or months to come. Consider March’s volatility alone:
- The week of March 3rd saw typical ups-and-downs in sales that could be seen for any number of reasons, during any number of times of the year.
- The following week, March 10th to 16th, produced the massive swings noted earlier.
- The next week, March 17th to 23rd, experienced a considerable moderation in swings.
- March 24th to 30th incurred some corrections and several dips, as shoppers realized they bought what they needed and they would be able to buy more as needed.
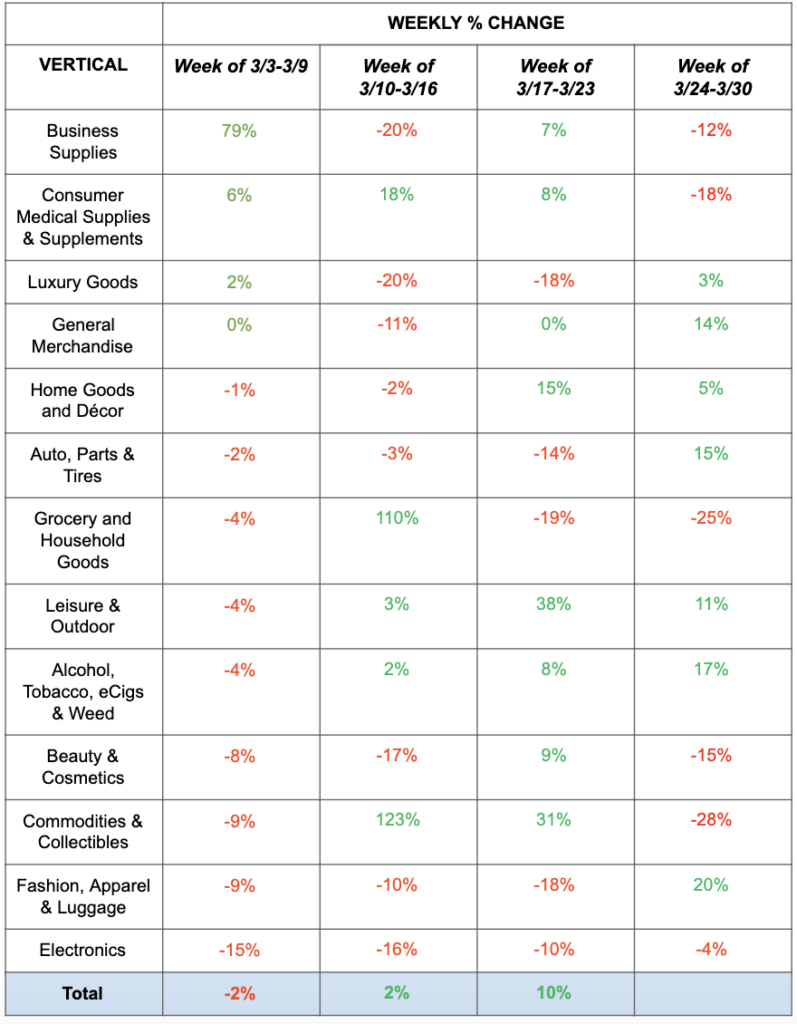
In fact, data for the week ending March 30, showed that products which had flown off the digital shelves earlier in March slowed considerably. Groceries, which saw a 110% sales increase in mid-March, dipped 25%. The story was similar for consumer packaged goods. Even the “commodities and collectibles” category, which includes gold bars and other precious metals, slid 28% week-over-week after two weeks of strong growth. Baby products and pet supplies endured slowing sales by the end of March, as well, after seeing strong sales in mid-March when consumers first braced themselves for a long stretch of staying at home.
The pattern could be an indication that, in some categories, the pandemic has prompted consumers to buy more, and buy faster than they normally would. That could mean that retailers in particular verticals, like baby products and pet supplies, are simply getting an advance on sales that typically would be spread out over a longer period.
The one trend that didn’t slow in late March was buying items that make home more entertaining and comfortable, largely attributable to the government’s extension of shelter-in-place guidelines. Home goods, along with leisure and outdoor products—including games, video games, exercise equipment—continued to increase, albeit at a slower rate, into April. The category including alcohol and cannabis saw its biggest gain of the month toward the end when it shot up 17%, though the category reported sales increases in each of the weeks since the pandemic was declared.
As we collectively shop-and-shelter-in-place through April, we’ll see which categories continue showing strong gains and which might, unexpectedly, fall flat or come up from behind.
Get more details on this COVID research
We’re going to deep dive into Signfyd’s research live in the upcoming CommerceNext Webinar sponsored by Signifyd on Wednesday, April 22nd at 2pm ET / 11am PT.
Followed by a panel discussion with:
- Sucharita Kodali, VP and Principal Analyst, Forrester Research
- Rebecca Traverzo, VP of Marketing, ThirdLove
- Briana Walling Burwell, Vice President of Finance, Build.com
- J Bennett, VP, Operations and Corporate Development, Signifyd
Sign up for the webinar here.
For ongoing data, please visit Signifyd’s Ecommerce Pulse hub page.